Prepared Exclusively for Albert Sharaf
July 2026

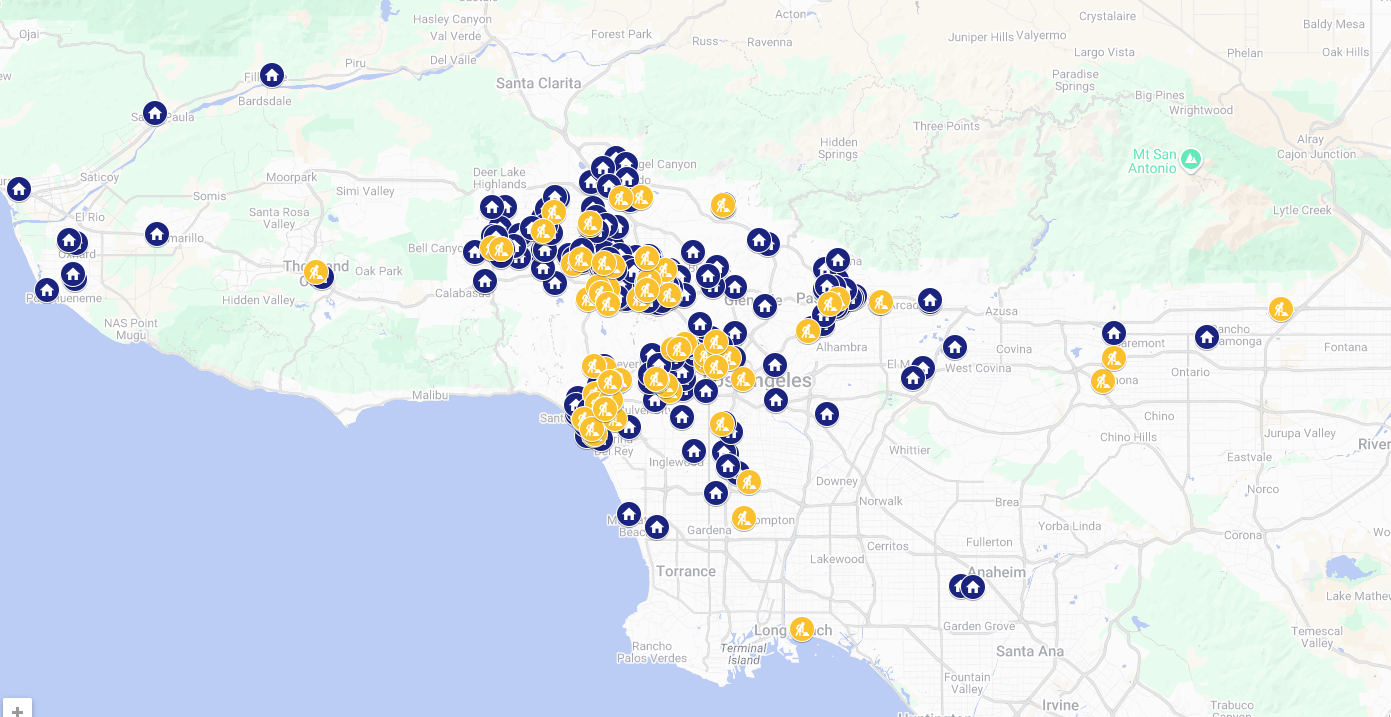
Since 2013, the LAAA Team has closed 484 multifamily and investment transactions totaling $1.5B in volume across Los Angeles and Ventura counties, with a particular depth in the southern San Fernando Valley submarkets of Studio City, Toluca Lake, Sherman Oaks, and North Hollywood.
Our practice is built on disciplined underwriting, the deepest comparable-sales dataset in the submarket, and a marketing engine that reaches every active multifamily buyer in Los Angeles. We advise owners on when and how to sell - not just whether - and we price to clear, not to languish.
For 10840 Bluffside Dr, that means an evidence-based opinion of value anchored in recent Studio City closed sales and the active competing inventory, presented with the same rigor we would bring to defending the price against a buyer's due-diligence challenge.


• Chairman's Club - Marcus & Millichap's top-tier annual honor
• National Achievement Award - multiple years, both partners
• #1 Most Active Multifamily Team in LA County - CoStar 2019-2021
• Sales Recognition Award - every year since 2016
• 40+ transactions per year - one of SoCal's most active groups
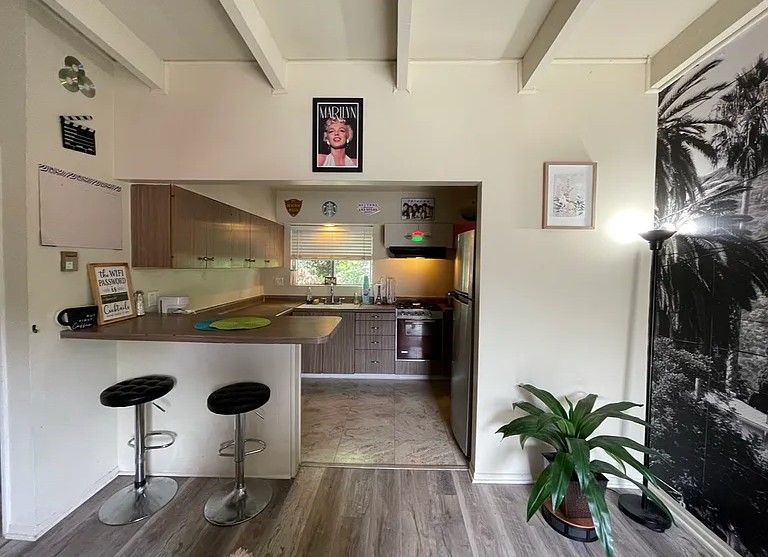
10840 Bluffside Dr is a 12-unit, fee-simple apartment community in the heart of Studio City, offered free of existing debt. Ten 1BR/1BA units anchor the rent roll alongside one studio and one vacant 2BR/2BA townhome-style unit, in functional 400-1,400 SF floor plans that continue to lease well in this submarket.
In-place rents sit below the surrounding market across nearly every unit: bringing rents to market grows NOI from $135,784 to $181,090 - a $48,816 annual loss-to-lease captured entirely through natural unit turnover, with no renovation program required.
At $229,167/unit and $358/SF, the entry basis compares favorably to the $289,889/unit average of nearby closed sale comparables - an entry-point discount for a well-located asset, supporting upside on exit as well as entry.


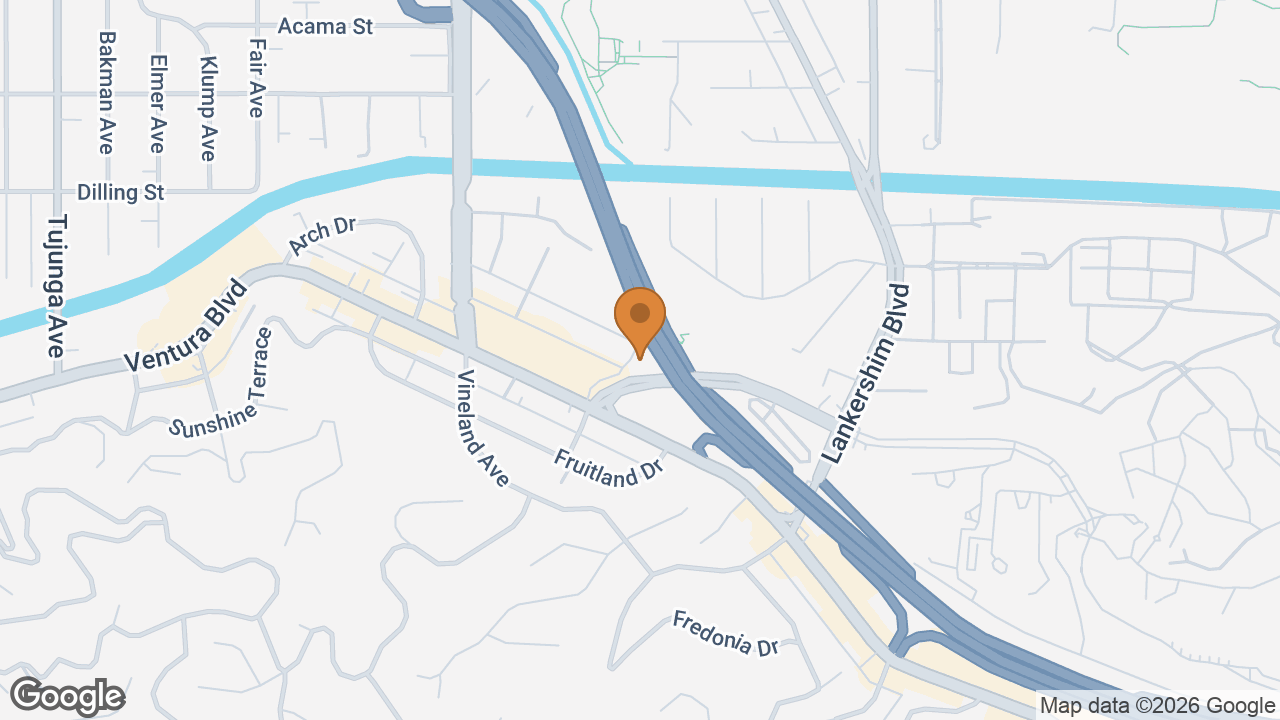
Nestled in the Los Angeles hillside submarket between the 101 Freeway and Mulholland Drive, Studio City combines a walkable commercial core with quiet residential streets - a consistently strong renter draw for well-located, small multifamily assets like 10840 Bluffside.
The property sits within walking distance of the Ventura Boulevard corridor's shops, restaurants, and grocery anchors, with convenient access to Radford Studio Center and the broader Los Angeles entertainment-industry employment base - Radford, Universal, Warner Bros., and Disney. The 101 Freeway provides fast connections to the greater San Fernando Valley and Westside, and the Metro B (Red) Line at Universal City reinforces the parcel's Transit Priority Area designation.
Submarket catalyst: Netflix is under contract to acquire the ±55-acre Radford Studio Center - roughly a mile from the subject - for approximately $400 million, with closing expected in Q3 2026. A permanent Netflix production anchor commits the world's largest streamer to Studio City for the long term, deepening the entertainment-employment base that drives the submarket's rental demand. Los Angeles Times · June 19, 2026 ↗
| Location Details | |
|---|---|
| Submarket | Studio City Core |
| ZIP | 91604 |
| Median HH Income | $141,875 |
| ZIP Population | 30,947 · Median Age 40.4 |
| Major Employers | Radford (Netflix), Universal, Warner Bros., Disney |
| Transit | Metro B Line · Universal City |
| Freeway Access | US-101 at Laurel Cyn / Coldwater |
| Ventura Blvd | ±0.5 mi |

Demographics: U.S. Census Bureau / ACS 5-year estimates (ZIP 91604); approximate and to be buyer-verified.
| Property Overview | |
|---|---|
| Units | 12 |
| Unit Mix | 10x 1BR/1BA, 1x Studio, 1x 2BR/2BA |
| Year Built | 1964 |
| Building SF | 7,676 |
| Ownership | Fee simple |
| Condition | Value-add; no renovation program required |
| Site & Zoning | |
|---|---|
| APN | 2366-022-061 |
| Lot Size | 9,612 SF (0.22 ac) |
| Zoning | R4-1-RIO |
| TOC Tier | Tier 3 · Transit Priority Area |
| Council District | CD 4 |
| Regulatory | |
|---|---|
| Rent Control (RSO) | Subject to LA RSO (1964 build) |
| Path to Market | Vacancy decontrol - units reset to market at turnover |
| Existing Debt | None - offered free & clear |
| Laundry | On-site (income $1,200/yr) |
| Income Profile | |
|---|---|
| Current GSR | $242,784/yr ($20,232/mo) |
| Market GSR | $291,600/yr ($24,300/mo) |
| Loss-to-Lease | $48,816/yr (+20.1% to market) |
| Current NOI | $135,784 |
| Pro Forma NOI | $181,090 |
1031 Exchange Buyers
Investors trading into a prime-submarket asset with a defined, turnover-driven NOI growth path and no capital-intensive repositioning required.
Private Local Investors
Valley and Westside-adjacent owners who understand Studio City's rent depth and want a below-comp-basis entry at $229,167/unit.
Value-Add Operators
Hands-on buyers targeting the $48,816 annual loss-to-lease - a 33% NOI lift captured unit by unit through natural turnover.
A clean, debt-free capitalization and a rent roll that is 20% below market broadens the buyer pool well beyond the typical 1960s twelve-unit.
"It's RSO - how do I ever get to market rents?"
Through vacancy decontrol: each unit resets to market on turnover. The pro forma requires no renovation program and no buyouts - the ten 1BR units average +25% to market, and the market rents are proven by six active comparables within a short radius.
"A 4.94% going-in cap is thin."
The going-in cap sits inside the closed-comp range (4.60%-6.00%), but the basis does the work: $229,167/unit is 20.9% below the comp-set average, and every dollar of the $48,816 loss-to-lease converts to value at exit.
"It's a 1964 building."
Same-vintage product dominates the comp set (1958-1971 across all four closed sales). The asset is low-density on a 9,612 SF lot with functional 400-1,400 SF floor plans that continue to lease well in this submarket.
"Are the market rents real?"
The pro forma uses $1,700 (studio), $2,000 (1BR), and $2,600 (2BR) - each set conservatively BELOW the named, currently marketed comparables on Bluffside, Fruitland, Arch, Tujunga, and Vineland, which advertise at $1,895-$2,950 (see Financial Analysis).

| Address | Submarket | Yr | Units | Sale Price | $/Unit | $/SF | Cap | Dist | Sold |
|---|---|---|---|---|---|---|---|---|---|
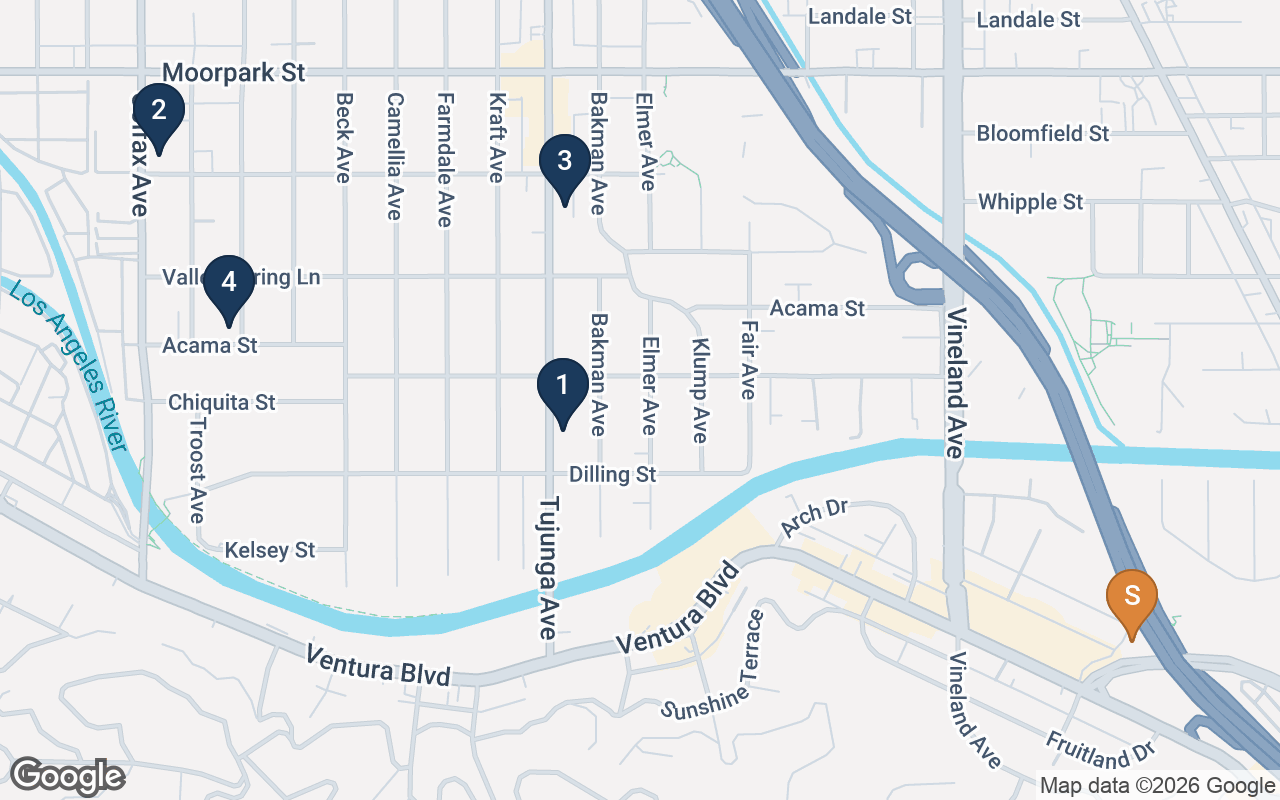
| 4156 Tujunga Ave · photos ↗ | Studio City | 1971 | 6 | $1,899,000 | $316,500 | $412 | 5.31% | 0.74 mi | Feb 2026 |
| 4350 Colfax Ave · photos ↗ | Studio City | 1958 | 9 | $2,000,000 | $222,222 | $340 | 5.27% | 1.33 mi | Nov 2025 |
| 4300 Tujunga Ave · photos ↗ | Studio City | 1963 | 10 | $2,975,000 | $297,500 | $335 | 4.60% | 0.88 mi | Jul 2026 |
| 11607 Acama St · photos ↗ | Studio City | 1971 | 12 | $3,880,000 | $323,333 | $242 | 6.00% | 1.17 mi | Mar 2026 |
| Average (4 sold comps) | $2,688,500 | $289,889 | $332 | 5.30% | - | - | |||
| SUBJECT · 10840 Bluffside Dr | Studio City | 1964 | 12 | $2,750,000 | $229,167 | $358 | 4.94%* | - | Offered |
*Subject cap shown on current income; 6.59% pro forma at market rents. Comp data from the LAAA underwriting model and closed-sale records - not third-party OM marketing materials.
1. 4156 Tujunga Ave - A six-unit 1971 building 0.74 mi from the subject, closed February 2026 at a 5.31% cap and 12.32x GRM. Its $412/SF print - the highest in the set - shows what smaller Studio City assets command per foot and frames the subject's $358/SF as conservative.
2. 4350 Colfax Ave - Nine units, 1958 vintage, closed November 2025 at $222,222/unit and a 5.27% cap. The closest per-unit print to the subject's basis - and the subject delivers a materially deeper rent-upside story at effectively the same entry price per unit.
3. 4300 Tujunga Ave - Ten units, 1963, closed July 2026 at $297,500/unit and a 4.60% cap - the compressed-yield end of the range, three buildings from Tujunga Village. Buyers accepted 4.60% going-in for a well-located Studio City walk-up; the subject offers 4.94% going-in with far more rent upside.
4. 11607 Acama St - The only twelve-unit comp, 1971 townhome-style product on an oversized corner lot, closed March 2026 at $323,333/unit and a 6.00% cap. It anchors the top of the cap range and shows the exit math: at stabilized income, the subject's pro forma 6.59% cap at list would command a substantial premium in resale.

| Address | Submarket | Yr | Units | List Price | $/Unit | $/SF | Status |
|---|---|---|---|---|---|---|---|
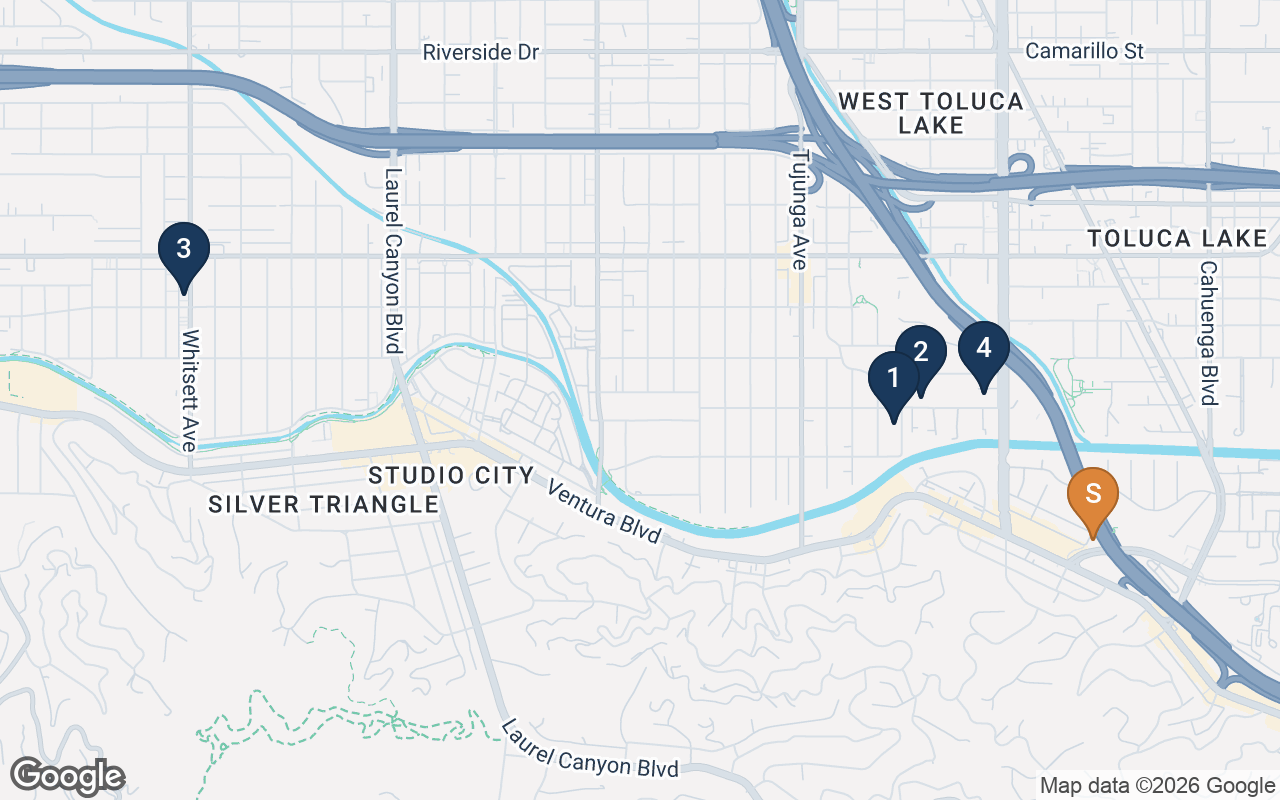
| 4173 Fair Ave | Studio City | 1975 | 5 | $1,825,000 | $365,000 | $340 | Active · M&M |
| 11155 Aqua Vista St | Studio City | 1988 | 14 | $4,999,999 | $357,143 | $413 | Active |
| 4307 Whitsett Ave | Studio City | 1985 | 16 | $6,700,000 | $418,750 | $401 | Active · LAAA Listing |
| 4215 Vineland Ave | Studio City | 1962 | 32 | $7,975,000 | $249,219 | $280 | Active · Reduced |
| Average (4 active comps) | $5,375,000 | $347,528 | $358 | - | |||
The active inventory frames the subject's pricing from above. Every competing listing in the submarket asks more per unit than the subject's $229,167 - from $249,219/unit on the 1962-vintage Vineland value-add up to $418,750/unit on the 1985-built Whitsett walk-up - and the active set's average asking $/SF ($358) lands exactly at the subject's $358/SF. The cautionary tale is 4215 Vineland: the closest vintage-and-strategy comparable began at $8,450,000 and has already been reduced to $7,975,000 while it sits. The subject at $2,750,000 is deliberately positioned below the active per-unit field - and below the closed-comp average - to clear, not to sit.
| Unit | Type | SF | Rent/Mo | Rent/SF | Status | Notes |
|---|---|---|---|---|---|---|
| 1 | 2BR / 2BA | 1,400 | $2,600 | $1.86 | Vacant | Underwritten at $2,600 market |
| 2 | 1BR / 1BA | 575 | $1,269 | $2.21 | Occupied | Market $2,000 · +57.6% |
| 3 | 1BR / 1BA | 575 | $1,219 | $2.12 | Occupied | Market $2,000 · +64.1% |
| 4 | 1BR / 1BA | 575 | $1,750 | $3.04 | Occupied | Market $2,000 · +14.3% |
| 5 | 1BR / 1BA | 575 | $1,010 | $1.76 | Occupied | Market $2,000 · +98.0% |
| 6 | 1BR / 1BA | 575 | $1,663 | $2.89 | Occupied | Market $2,000 · +20.3% |
| 7 | Studio | 400 | $1,595 | $3.99 | Occupied | Market $1,700 · +6.6% |
| 8 | 1BR / 1BA | 575 | $1,900 | $3.30 | Occupied | Market $2,000 · +5.3% |
| 9 | 1BR / 1BA | 575 | $1,695 | $2.95 | Occupied | Market $2,000 · +18.0% |
| 10 | 1BR / 1BA | 575 | $1,868 | $3.25 | Occupied | Market $2,000 · +7.1% |
| 11 | 1BR / 1BA | 575 | $1,895 | $3.30 | Occupied | Market $2,000 · +5.5% |
| 12 | 1BR / 1BA | 575 | $1,768 | $3.07 | Occupied | Market $2,000 · +13.1% |
| Total | 12 units | 7,676 | $20,232/mo | $2.64 | 11 of 12 occ. | Market $24,300/mo · +20.1% |
Rent roll as of July 2026, per owner-provided rent roll. Eleven of twelve units are occupied; the vacant 2BR/2BA is carried at its $2,600 market rent in scheduled income.
| Address | Unit Type | SF | Rent | Rent/SF |
|---|---|---|---|---|
| 10979 Bluffside Dr | Studio | 426 | $1,895 | $4.45 |
| 4176 Arch Dr | Studio | 485 | $1,895 | $3.91 |
| 10913 Fruitland Dr | 1BR / 1BA | 800 | $2,295 | $2.87 |
| 10900 Bluffside Dr | 1BR / 1BA | 618 | $2,295 | $3.71 |
| 4215 Tujunga Ave | 2BR / 2BA | 1,020 | $2,895 | $2.84 |
| 4335 Vineland Ave | 2BR / 2BA | 1,235 | $2,950 | $2.39 |
Recently marketed comparable units within a short radius, compiled from company research and LAAA Comps. The pro forma applies $1,700 (studio), $2,000 (1BR), and $2,600 (2BR) - set conservatively below every advertised comp above.
| Operating Statement | Current | Per Unit | Pro Forma | Per Unit |
|---|---|---|---|---|
| Gross Potential Rent [1] | $291,600 | $24,300 | $291,600 | $24,300 |
| Loss / Gain to Lease | ($48,816) | ($4,068) | $0 | $0 |
| Gross Scheduled Rent | $242,784 | $20,232 | $291,600 | $24,300 |
| Less: Vacancy (3.0%) | ($7,284) | ($607) | ($8,748) | ($729) |
| Other Income (Laundry) | $1,200 | $100 | $1,200 | $100 |
| Effective Gross Income | $236,700 | $19,725 | $284,052 | $23,671 |
| Real Estate Taxes [2] | $34,375 | $2,865 | $34,375 | $2,865 |
| Insurance | $16,000 | $1,333 | $16,480 | $1,373 |
| Utilities | $17,586 | $1,466 | $13,596 | $1,133 |
| Trash Removal | $4,200 | $350 | $4,326 | $361 |
| Repairs & Maintenance | $10,240 | $853 | $11,742 | $979 |
| Landscaping | $2,400 | $200 | $3,090 | $258 |
| General & Administrative | $1,280 | $107 | $2,060 | $172 |
| Misc. Expenses | $3,000 | $250 | $3,090 | $258 |
| Management Fee (5.0%) [3] | $11,835 | $986 | $14,203 | $1,184 |
| Total Operating Expenses | $100,916 | $8,410 | $102,962 | $8,580 |
| Net Operating Income | $135,784 | $11,315 | $181,090 | $15,091 |
[1] Gross Potential Rent: All 12 units at market rents of $1,700 (studio), $2,000 (1BR), and $2,600 (2BR) - $291,600/yr. Current column deducts the $48,816 loss-to-lease between in-place rents and market; the vacant 2BR/2BA is carried at its $2,600 market rent. Pro forma assumes in-place units are brought to market upon natural turnover.
[2] Real Estate Taxes: LA County reassesses to the purchase price at close. Shown at 1.25% of the $2,750,000 list price in both scenarios.
[3] Management Fee: Held at 5.0% of Effective Gross Income in both scenarios.
Expense pro forma: Reflects a stabilized management fee and modest inflationary growth on controllable lines; utilities normalize downward with tenant turnover. Expenses run 42.6% of EGI current, 36.2% pro forma.
Source: broker underwriting model, owner-provided rent roll and expense detail. Buyer to verify actuals in due diligence.
| Operating Data | |
|---|---|
| Price | $2,750,000 |
| Down Payment (40%) | $1,100,000 |
| Number of Units | 12 |
| Price / Unit | $229,167 |
| Price / SF | $358.26 |
| Gross SF | 7,676 |
| Year Built | 1964 |
| Returns (Current / Pro Forma) | |
|---|---|
| Cap Rate | 4.94% / 6.59% |
| GRM | 11.33x / 9.43x |
| Cash-on-Cash | 1.55% / 5.67% |
| DSCR | 1.14x / 1.53x |
| Financing (Illustrative) | |
|---|---|
| Loan Amount | $1,650,000 |
| Rate / Amort | 6.00% / 30yr |
| Loan Constant | 7.19% |
| LTV | 60.0% |
| Loan Maturity | 2029 |
| Income (Current) | |
|---|---|
| Gross Scheduled Rent | $242,784 |
| Less Vacancy (3%) | ($7,284) |
| Other Income (Laundry) | $1,200 |
| Effective Gross Income | $236,700 |
| Operating Expenses | ($100,916) |
| Net Operating Income | $135,784 |
| Cash Flow (Current / Pro Forma) | |
|---|---|
| Net Operating Income | $135,784 / $181,090 |
| Debt Service | ($118,711) |
| Net Cash Flow | $17,073 / $62,379 |
| + Principal Reduction | $20,262 |
| Total Return | 3.39% / 7.51% |
| Expense Ratio (Current) | |
|---|---|
| OpEx / EGI | 42.6% |
| OpEx / Unit | $8,410 |
| OpEx / SF | $13.15 |
| Purchase Price | Current Cap | Pro Forma Cap | Cash-on-Cash | $/Unit | $/SF | GRM | DSCR |
|---|---|---|---|---|---|---|---|
| $2,750,000 | 4.94% | 6.59% | 1.55% | $229,167 | $358 | 11.33x | 1.14x |
| $2,700,000 | 5.05% | 6.73% | 1.84% | $225,000 | $352 | 11.12x | 1.17x |
| $2,650,000 | 5.17% | 6.88% | 2.14% | $220,833 | $345 | 10.92x | 1.20x |
| $2,600,000 | 5.29% | 7.04% | 2.44% | $216,667 | $339 | 10.71x | 1.23x |
| $2,550,000 | 5.42% | 7.20% | 2.77% | $212,500 | $332 | 10.50x | 1.26x |
| $2,500,000 | 5.56% | 7.37% | 3.10% | $208,333 | $326 | 10.30x | 1.29x |
Matrix holds the operating structure constant and re-scales only real estate taxes (1.25% of price) and financing (60% LTV, 6.00%/30yr). Cash-on-Cash, GRM, and DSCR shown on current income; GRM on current Gross Scheduled Rent of $242,784.
The list price of $2,750,000 reconciles three independent pricing lenses. On a per-unit basis ($229,167) it sits 20.9% below the sold-comp average of $289,889 - a genuine entry discount despite comparable or superior in-place quality. On cap rate, the 4.94% going-in yield lands inside the closed-comp range of 4.60%-6.00%, while the 6.59% pro forma cap at market rents exceeds every closed sale in the set. On price-per-SF ($358), the subject carries a modest premium to the sold-comp average ($332) that the 20% rent upside more than accounts for - and matches the active inventory's average ask ($358/SF) exactly. The trade range shown above runs from the $2,750,000 list down to $2,500,000, where the current-income cap reaches 5.56% and the pro forma cap 7.37%.
The active competing inventory reinforces the positioning: every on-market listing asks more per unit than the subject, and the closest vintage comparable (4215 Vineland) has already taken a price reduction while it sits. The subject is priced to clear within an industry-standard 60-90 day marketing window, with room for competitive bidding to press the price upward.